
Page 8 - INTERCARGO - Bulk Carrier Casualty Report 2025
P. 8
SUMMARY
• 20 bulk carriers (of over 10,000 dwt ) have been identified
1
as total losses for the years 2015 to 2024.
2
• Three bulk carrier casualties and four associated lives lost
in the Red Sea as a direct consequence of missile, drone
and drone boat attacks during the period were not includ-
ed in the statistics, with details of them at the end of the
section Casualty list of the Report.
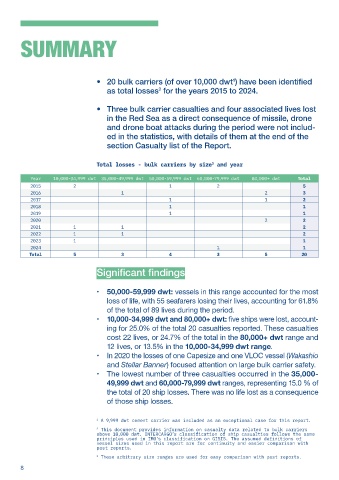
Total losses - bulk carriers by size and year
3
Year 10,000-34,999 dwt 35,000-49,999 dwt 50,000-59,999 dwt 60,000-79,999 dwt 80,000+ dwt Total
2015 2 1 2 5
2016 1 2 3
2017 1 1 2
2018 1 1
2019 1 1
2020 2 2
2021 1 1 2
2022 1 1 2
2023 1 1
2024 1 1
Total 5 3 4 3 5 20
Significant findings
• 50,000-59,999 dwt: vessels in this range accounted for the most
loss of life, with 55 seafarers losing their lives, accounting for 61.8%
of the total of 89 lives during the period.
• 10,000-34,999 dwt and 80,000+ dwt: five ships were lost, account-
ing for 25.0% of the total 20 casualties reported. These casualties
cost 22 lives, or 24.7% of the total in the 80,000+ dwt range and
12 lives, or 13.5% in the 10,000-34,999 dwt range.
• In 2020 the losses of one Capesize and one VLOC vessel (Wakashio
and Stellar Banner) focused attention on large bulk carrier safety.
• The lowest number of three casualties occurred in the 35,000-
49,999 dwt and 60,000-79,999 dwt ranges, representing 15.0 % of
the total of 20 ship losses. There was no life lost as a consequence
of those ship losses.
1 A 9,999 dwt cement carrier was included as an exceptional case for this report.
2 This document provides information on casualty data related to bulk carriers
above 10,000 dwt. INTERCARGO’s classification of ship casualties follows the same
principles used in IMO’s classification on GISIS. The assumed definitions of
vessel sizes used in this report are for continuity and easier comparison with
past reports.
3 These arbitrary size ranges are used for easy comparison with past reports.
8