
Page 12 - INTERCARGO - Bulk Carrier Casualty Report 2025
P. 12
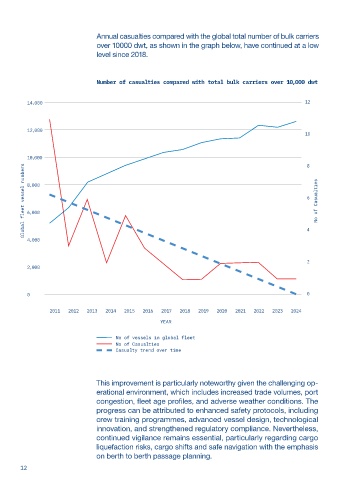
Annual casualties compared with the global total number of bulk carriers
                                   over 10000 dwt, as shown in the graph below, have continued at a low
                                   level since 2018.


                                   Number of casualties compared with total bulk carriers over 10,000 dwt


           14,000


           12,000


           10,000
         Global fleet vessel numbers  8,000                                                                     No of Casualties


           6,000


           4,000


           2,000


           0

                  2011   2012   2013  2014   2015  2016   2017  2018   2019  2020   2021  2022   2023  2024

                                                         YEAR

                                          No of vessels in global fleet
                                          No of Casualties
                                          Casualty trend over time


                                   This improvement is particularly noteworthy given the challenging op-
                                   erational environment, which includes increased trade volumes, port
                                   congestion, fleet age profiles, and adverse weather conditions. The
                                   progress can be attributed to enhanced safety protocols, including
                                   crew training programmes, advanced vessel design, technological
                                   innovation, and strengthened regulatory compliance. Nevertheless,
                                   continued vigilance remains essential, particularly regarding cargo
                                   liquefaction risks, cargo shifts and safe navigation with the emphasis
                                   on berth to berth passage planning.

        12