Page 39 - INTERCARGO - Annual Report Report 2022 - 2023
P. 39

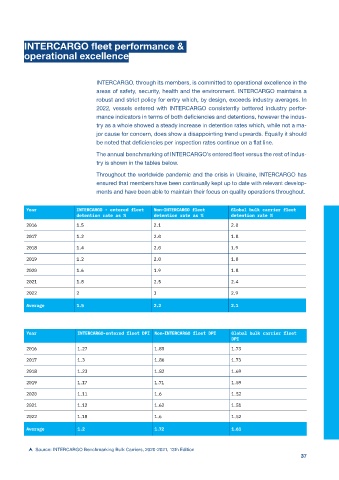
INTERCARGO fleet performance &

          operational excellence


                                   INTERCARGO, through its members, is committed to operational excellence in the
                                   areas of safety, security, health and the environment. INTERCARGO maintains a
                                   robust and strict policy for entry which, by design, exceeds industry averages. In
                                   2022, vessels entered with INTERCARGO consistently bettered industry perfor-
                                   mance indicators in terms of both deficiencies and detentions, however the indus-
                                   try as a whole showed a steady increase in detention rates which, while not a ma-
                                   jor cause for concern, does show a disappointing trend upwards. Equally it should
                                   be noted that deficiencies per inspection rates continue on a flat line.
                                   The annual benchmarking of INTERCARGO’s entered fleet versus the rest of indus-
                                   try is shown in the tables below.

                                   Throughout the worldwide pandemic and the crisis in Ukraine, INTERCARGO has
                                   ensured that members have been continually kept up to date with relevant develop-
                                   ments and have been able to maintain their focus on quality operations throughout.

          Year              INTERCARGO - entered fleet   Non-INTERCARGO fleet     Global bulk carrier fleet
                            detention rate as %        detention rate as %        detention rate %

          2016              1.5                        2.1                        2.0
          2017              1.2                        2.0                        1.8

          2018              1.4                        2.0                        1.9
          2019              1.2                        2.0                        1.8
          2020              1.6                        1.9                        1.8

          2021              1.8                        2.5                        2.4

          2022              2                          3                          2.9
          Average           1.5                        2.2                        2.1


          Year              INTERCARGO-entered fleet DPI Non-INTERCARGO fleet DPI  Global bulk carrier fleet
                                                                                  DPI
          2016              1.27                       1.85                       1.73
          2017              1.3                        1.86                       1.73

          2018              1.23                       1.82                       1.69
          2019              1.17                       1.71                       1.59

          2020              1.11                       1.6                        1.52
          2021              1.12                       1.62                       1.51
          2022              1.18                       1.6                        1.52

          Average           1.2                        1.72                       1.61


             Source: INTERCARGO Benchmarking Bulk Carriers, 2020-2021, 13th Edition
                                                                                                           37
   34   35   36   37   38   39   40   41   42   43   44