Page 38 - INTERCARGO - Annual Report Report 2022 - 2023
P. 38

ANNUAL REVIEW


            Membership                                                                                                           INTERCARGO fleet performance &

                                                                                                                                 operational excellence


            Membership evolution                                                                                                                          INTERCARGO, through its members, is committed to operational excellence in the

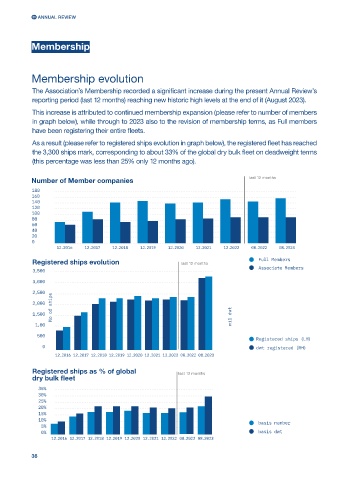
            The Association’s Membership recorded a significant increase during the present Annual Review’s                                               areas of safety, security, health and the environment. INTERCARGO maintains a
            reporting period (last 12 months) reaching new historic high levels at the end of it (August 2023).                                           robust and strict policy for entry which, by design, exceeds industry averages. In
                                                                                                                                                          2022, vessels entered with INTERCARGO consistently bettered industry perfor-
            This increase is attributed to continued membership expansion (please refer to number of members
                                                                                                                                                          mance indicators in terms of both deficiencies and detentions, however the indus-
            in graph below), while through to 2023 also to the revision of membership terms, as Full members
                                                                                                                                                          try as a whole showed a steady increase in detention rates which, while not a ma-
            have been registering their entire fleets.
                                                                                                                                                          jor cause for concern, does show a disappointing trend upwards. Equally it should
            As a result (please refer to registered ships evolution in graph below), the registered fleet has reached                                     be noted that deficiencies per inspection rates continue on a flat line.
            the 3,300 ships mark, corresponding to about 33% of the global dry bulk fleet on deadweight terms                                             The annual benchmarking of INTERCARGO’s entered fleet versus the rest of indus-
            (this percentage was less than 25% only 12 months ago).                                                                                       try is shown in the tables below.

                                                                                                                                                          Throughout the worldwide pandemic and the crisis in Ukraine, INTERCARGO has
                                                                                         last 12 months
            Number of Member companies
                                                                                                                                                          ensured that members have been continually kept up to date with relevant develop-
            180                                                                                                                                           ments and have been able to maintain their focus on quality operations throughout.
            160
            140
            120                                                                                                                  Year              INTERCARGO - entered fleet   Non-INTERCARGO fleet     Global bulk carrier fleet
            100                                                                                                                                    detention rate as %        detention rate as %        detention rate %
            80
            60                                                                                                                   2016              1.5                        2.1                        2.0
            40
            20                                                                                                                   2017              1.2                        2.0                        1.8
            0
                     12.2016   12.2017  12.2018   12.2019   12.2020   12.2021   12.2022  08.2022   08.2023                       2018              1.4                        2.0                        1.9
                                                                                            Full Members                         2019              1.2                        2.0                        1.8
            Registered ships evolution                           last 12 months
            3,500                                                                           Associate Members                    2020              1.6                        1.9                        1.8
            3,000                                                                                                                2021              1.8                        2.5                        2.4
            2,500                                                                                                                2022              2                          3                          2.9
                   No of ships
            2,000                                                                                                                Average           1.5                        2.2                        2.1
            1,500                                                                 mil dwt
             1,00
                                                                                                                                 Year              INTERCARGO-entered fleet DPI Non-INTERCARGO fleet DPI  Global bulk carrier fleet
              500
                                                                                           Registered ships (LH)                                                                                         DPI
                0                                                                          dwt registered (RH)                   2016              1.27                       1.85                       1.73
                    12.2016 12.2017 12.2018 12.2019 12.2020 12.2021 12.2022 08.2022 08.2023
                                                                                                                                 2017              1.3                        1.86                       1.73

            Registered ships as % of global                     last 12 months                                                   2018              1.23                       1.82                       1.69
            dry bulk fleet
                                                                                                                                 2019              1.17                       1.71                       1.59
               35%
              30%                                                                                                                2020              1.11                       1.6                        1.52
              25%
              20%                                                                                                                2021              1.12                       1.62                       1.51
              15%                                                                                                                2022              1.18                       1.6                        1.52
              10%                                                                           basis number
               5%                                                                                                                Average           1.2                        1.72                       1.61
               0%                                                                           basis dwt
                   12.2016 12.2017 12.2018 12.2019 12.2020 12.2021 12.2022 08.2022 08.2023

                                                                                                                                    Source: INTERCARGO Benchmarking Bulk Carriers, 2020-2021, 13th Edition
            36                                                                                                                                                                                                                    37
   33   34   35   36   37   38   39   40   41   42   43