Page 37 - INTERCARGO - Annual Report_2021
P. 37

INTERCARGO fleet performance & operational excellence


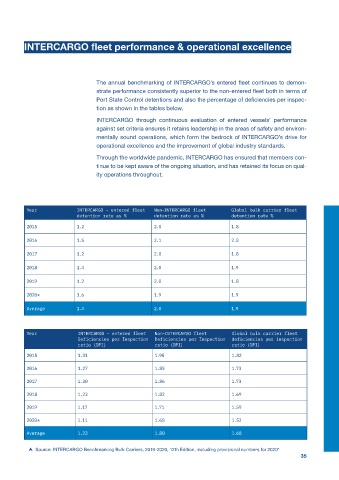
                                   The annual benchmarking of INTERCARGO’s entered fleet continues to demon-
                                   strate performance consistently superior to the non-entered fleet both in terms of
                                   Port State Control detentions and also the percentage of deficiencies per inspec-
                                   tion as shown in the tables below.

                                   INTERCARGO through continuous evaluation of entered vessels’ performance
                                   against set criteria ensures it retains leadership in the areas of safety and environ-
                                   mentally sound operations, which form the bedrock of INTERCARGO’s drive for
                                   operational excellence and the improvement of global industry standards.
                                   Through the worldwide pandemic, INTERCARGO has ensured that members con-
                                   tinue to be kept aware of the ongoing situation, and has retained its focus on qual-
                                   ity operations throughout.


          Year              INTERCARGO - entered fleet   Non-INTERCARGO fleet     Global bulk carrier fleet
                            detention rate as %        detention rate as %        detention rate %

          2015              1.2                        2.0                        1.8

          2016              1.5                        2.1                        2.0

          2017              1.2                        2.0                        1.8

          2018              1.4                        2.0                        1.9

          2019              1.2                        2.0                        1.8

          2020*             1.6                        1.9                        1.9

          Average           1.4                        2.0                        1.9


          Year              INTERCARGO - entered fleet   Non-INTERCARGO fleet     Global bulk carrier fleet
                            Deficiencies per Inspection  Deficiencies per Inspection  deficiencies per inspection
                            ratio (DPI)                ratio (DPI)                ratio (DPI)
          2015              1.31                       1.95                       1.82

          2016              1.27                       1.85                       1.73

          2017              1.30                       1.86                       1.73

          2018              1.23                       1.82                       1.69
          2019              1.17                       1.71                       1.59

          2020*             1.11                       1.60                       1.52

          Average           1.23                       1.80                       1.68


             Source: INTERCARGO Benchmarking Bulk Carriers, 2019-2020, 12th Edition, including provisional numbers for 2020*
                                                                                                           35
   32   33   34   35   36   37   38   39   40   41   42