
Page 36 - INTERCARGO - Annual Review 2019/2020
P. 36
ANNUAL REVIEW
Fleet & Performance
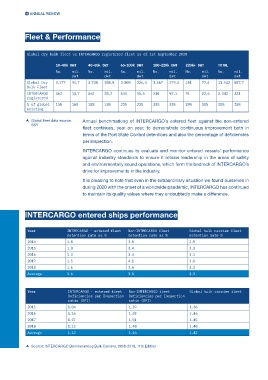
Global dry bulk fleet vs INTERCARGO registered fleet as of 1st September 2020
10-40k DWT 40-65k DWT 65-100k DWT 100-220k DWT 220k+ DWT TOTAL
No. mil. No. mil. No. mil. No. mil. No. mil. No. mil.
dwt dwt dwt dwt dwt dwt
Global Dry 3.177 95,7 3.738 208,8 2.809 226,4 1.567 279,4 251 77,4 11.542 887,7
Bulk Fleet
INTERCARGO 462 15,7 662 38,2 634 51,5 510 92,1 74 23,6 2.342 221
registered
% of global 15% 16% 18% 18% 23% 23% 33% 33% 29% 30% 20% 25%
existing
Global fleet data source: Annual benchmarking of INTERCARGO’s entered fleet against the non-entered
SSY
fleet continues, year on year, to demonstrate continuous improvement both in
terms of the Port State Control detentions and also the percentage of deficiencies
per inspection.
INTERCARGO continues to evaluate and monitor entered vessels’ performance
against industry standards to ensure it retains leadership in the areas of safety
and environmentally sound operations, which form the bedrock of INTERCARGO’s
drive for improvements in the industry.
It is pleasing to note that even in the extraordinary situation we found ourselves in
during 2020 with the onset of a worldwide pandemic, INTERCARGO has continued
to maintain its quality values where they undoubtedly make a difference.
INTERCARGO entered ships performance
Year INTERCARGO - entered fleet Non-INTERCARGO fleet Global bulk carrier fleet
detention rate as % detention rate as % detention rate %
2014 1.8 3.0 2.9
2015 1.8 3.4 3.3
2016 1.3 3.3 3.1
2017 1.5 4.1 3.8
2018 1.6 3.6 3.3
Average 1.6 3.5 3.3
Year INTERCARGO - entered fleet Non-INTERCARGO fleet Global bulk carrier fleet
Deficiencies per Inspection Deficiencies per Inspection
ratio (DPI) ratio (DPI)
2015 1.04 1.39 1.36
2016 1.16 1.49 1.46
2017 1.17 1.51 1.45
2018 1.12 1.48 1.40
Average 1.12 1.46 1.42
Source: INTERCARGO Benchmarking Bulk Carriers, 2018-2019, 11th Edition